The Perils of Cherry Picking Low Frequency Events in Large Sample Surveys
Stephen Ansolabehere (Harvard University, PI CCES)
Samantha Luks (YouGov)
Brian F. Schaffner (University of Massachusetts, Amherst, co-PI CCES)
The advent of large sample surveys, such as the Cooperative Congressional Election Study (CCES), has opened the possibility of measuring very low frequency events, characteristics, and behaviors in the population. This is certainly a worthy objective, but researchers must use caution when studying low probability events and behaviors, such as non-citizenship rates and voting. Even very low-level measurement error can lead to classification and prediction errors and incorrect inferences in analyses.
This paper documents how low-level measurement error for survey questions generally agreed to be highly reliable can lead to large prediction errors in large sample surveys, such as the CCES. The example for this analysis is Richman, Chattha, and Earnest (2014), which presents a biased estimate of the rate at which non-citizens voted in recent elections. The results, we show, are completely accounted for by very low frequency measurement error; further, the likely percent of non-citizen voters in recent US elections is 0.
We begin with an example. Suppose a survey question is asked of 20,000 respondents, and that, of these persons, 19,500 have a given characteristic (e.g., are citizens) and 500 do not. Suppose that 99.9 percent of the time the survey question identifies correctly whether people have a given characteristic, and 0.1 percent of the time respondents who have a given characteristic incorrectly state that they do not have that characteristic. (That is, they check the wrong box by mistake.) That means, 99.9 percent of the time the question correctly classifies an individual as having a characteristic—such as being a citizen of the United States—and 0.1 percent of the time it classifies someone as not having a characteristic, when in fact they do. This rate of misclassification or measurement error is extremely low and would be tolerated by any survey researcher. It implies, however, that one expects 19 people out of 20,000 to be incorrectly classified as not having a given characteristic, when in fact they do.
Normally, this is not a problem. In the typical survey of 1,000 to 2,000 persons, such a low level of measurement error would have no detectable effect on the sample. Even in very large sample surveys, survey practitioners expect a very low level of measurement error would have effects that wash out between two categories. The non-citizen voting example highlights a potential pitfall with very large databases in the study of low frequency categories. Continuing with the example of citizenship and voting, the problem is that the citizen group is very large compared to the non-citizen group in the survey. So even if the classification is extremely reliable, a small classification error rate will cause the bigger category to influence analysis of the low frequency category is substantial ways. Misclassification of 0.1 percent of 19,500 respondents leads us to expect that 19 respondents who are citizens will be classified as non-citizens and 1 non-citizen will be classified as a citizen. (This is a statistical expectation—the actual numbers will vary slightly.) The one non-citizen classified as a citizen will have trivial effects on any analyses of the overall pool of people categorized as citizens, as that individual will be 1 of 19,481 respondents. However, the 19 citizens incorrectly classified as non-citizens can have significant effects on analyses, as they are 3.7 percent (19 of 519) of respondents who said they are non-citizens.
Such misclassifications can explain completely the observed low rate of a behavior, such as voting, among a relatively rare or low-frequency group, such as non-citizens. Suppose that 70 percent of those with a given characteristic (e.g., citizens) engage in a behavior (e.g., voting). Suppose, further, that none of the people without the characteristic (e.g., non-citizens) are allowed to engage in the behavior in question (e.g., vote in federal elections). Based on these suppositions, of the 19 misclassified people, we expect 13 (70%) to be incorrectly determined to be non-citizen voters while 0 correctly classified non-citizens would be voters. Hence, a 0.1 percent rate of misclassification—a very low level of measurement error—would lead researchers to expect to observe that 13 of 519 (2.8 percent) people classified as non-citizens voted in the election, when those results are due entirely to measurement error, and no non-citizens actually voted.
This example parallels the reliability and vote rates in the CCES 2010-2012 panel survey. From this we conclude that measurement error almost certainly explains the observed voting rate among self-identified non-citizens in the CCES—as reported by Richman and his colleagues. We develop this in three steps.
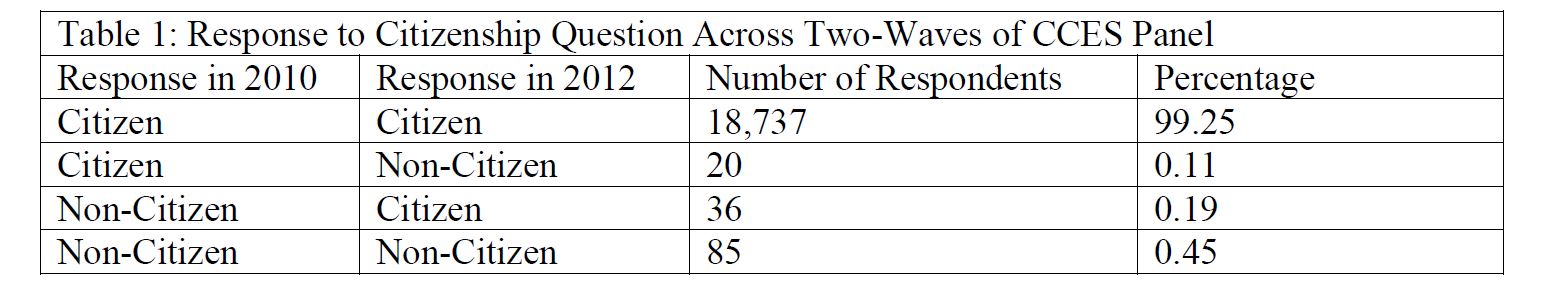
First, the citizenship classification in the CCES has a reliability rate of 99.9 percent. The citizenship question was asked in the 2010 and 2012 waves of a panel study conducted by CCES. Of those who stated that they were citizens in 2010, 99.9 percent stated that they were citizens in 2012, but 0.1 percent indicated on the 2012 survey form that they were non-citizen immigrants. This is a very high reliability rate and very low misclassification rate for self-identification questions. See Table 1.
Second, the validated voting rate among citizens in the CCES panel is 70 percent. In May 2011, following the 2010 election, the CCES data were matched to Catalist data on voter registration and vote history. May is the date for validation as that is when most states file their registration data with vote history for the previous year’s election. In the CCES panel, 90 percent of the respondents were successfully matched to the Catalist database in 2010. Of those matched, 91 percent were registered voters and 78 percent had cast a vote in 2010. However, if you include respondents who were unmatched to Catalist, 70 percent of the CCES panel were classified as validated voters in 2010.
Third, the panel shows clear evidence that the respondents who were identified as non-citizen voters by Richman et al. were misclassified. Clearly misclassified observations are the 20 respondents who reported being citizens in 2010 and non-citizens in 2012. Of those 20 respondents, a total of 3 respondents are classified by Catalist as having voted in 2010. Additionally, exactly 1 person is estimated to have voted in 2010, having been a non-citizen in 2010 and a citizen in 2012. (Note: This might not be an error as the person could have legally become a citizen in the intervening two years.) Both of these categories might include some citizens who are incorrectly classified as non-citizens in one of the waves.
Importantly, the group with the lowest likelihood of classification errors consists of those who reported being non-citizens in both 2010 and 2012. In this set, 0 percent of respondents cast valid votes. That is, among the 85 respondents who reported being non-citizens in 2010 and non-citizens in 2012, there are 0 valid voters for 2010. [1]
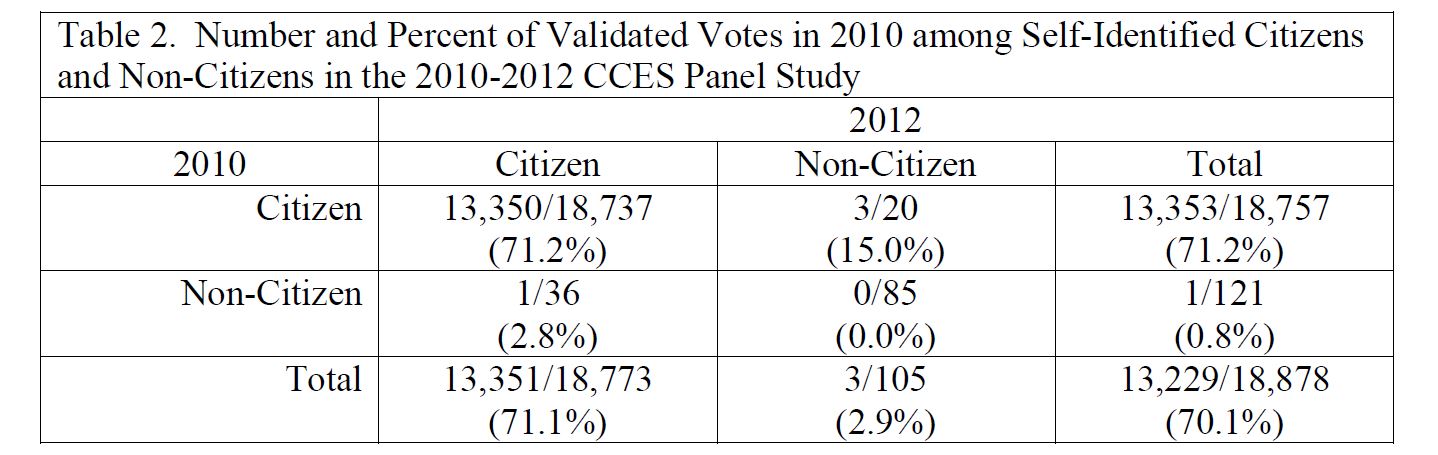
Fourth, the probability that the observed voters in the non-voter category are in fact citizens who have been misclassified is nearly 1. The expected number of citizens who are identified as non-citizens is 19 (0.1 percent times 18,878). The sample contains 105 persons who are identified as non-citizens in 2012. Assuming that the vote rate among citizens is .7, then the expected number of citizen voters who are classified as non-citizens is 13. Hence, we expect in a sample of 105 non-citizen persons that there would be 13 people who are in fact citizen voters but misclassified as non-citizens. The actual number of observed is only 4 (3 in 2010 and 1 in 2012). This is much lower than the expected number. Hence the probability that these 4 cases are in fact citizens identified as non-citizens is nearly 1. [2]
Richman and colleagues offer interpretations of their results based on predicted vote rates of non-citizens and the share of that group of all voters. Their calculations incorrectly assume that the validated vote of those who reported being non-citizens each year is an unbiased estimate of actual non-citizen voting rates. Our analysis indicates that all three of those cases are nearly certainly citizen voters who are misclassified as being non-citizens. Hence, their predicted vvote rates of non-citizens in fact reflect the behavior of citizens.
This problem arises because the survey was not designed to sample non-citizens, and the non-citizen category in the citizenship question is included for completeness and to identify those respondents who might be non-citizens. We expect that most of that group are in fact non-citizens (85 of 105), but the very low level of misclassification of citizens, who comprise 97.4 percent of the sample, means that we expect that 19 “non-citizen” respondents (16.5 percent of all reported non-citizens) are citizens who are misclassified. And, those misclassified people can readily account for the observed vote among those who reported that they are non-citizens.
Stepping back from the immediate question of whether the CCES in fact shows a low rate of voting among non-citizens, our analysis carries a much broader lesson and caution about the analysis of big databases to study low frequency characteristics and behaviors. Very low levels of measurement error are easily tolerated in samples of 1,000 to 2,000 persons. But in very large sample surveys, classification errors in a high-frequency category can readily contaminate a lowfrequency category, such as non-citizens. As a result, researchers may draw incorrect inferences concerning the behavior of relatively rare individuals in a population when there is even a very low level of misclassification.
--
1. For the 2012 election, there is one validated voter among the 85 respondents who answered non-citizen in both waves. However, this appears to be the result of a false positive match with Catalist. Indeed, the individual stated in both the 2010 and 2012 survey that she was not registered to vote.
2. Here we use a normal approximation to the underlying binomial distribution. The probability calculation is the probability of observing at least 3 citizens voters who are classified as noncitizen voters is 1-F((.029-.113)/.016) = 1-F(-5.5) = 1